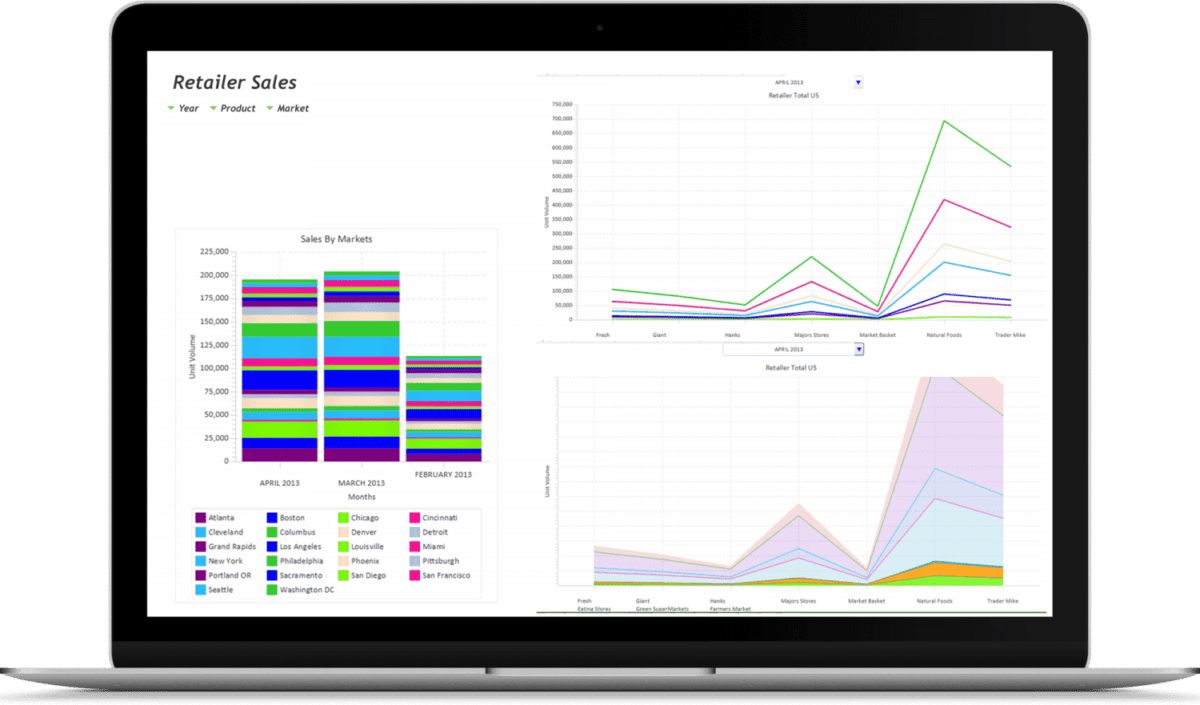
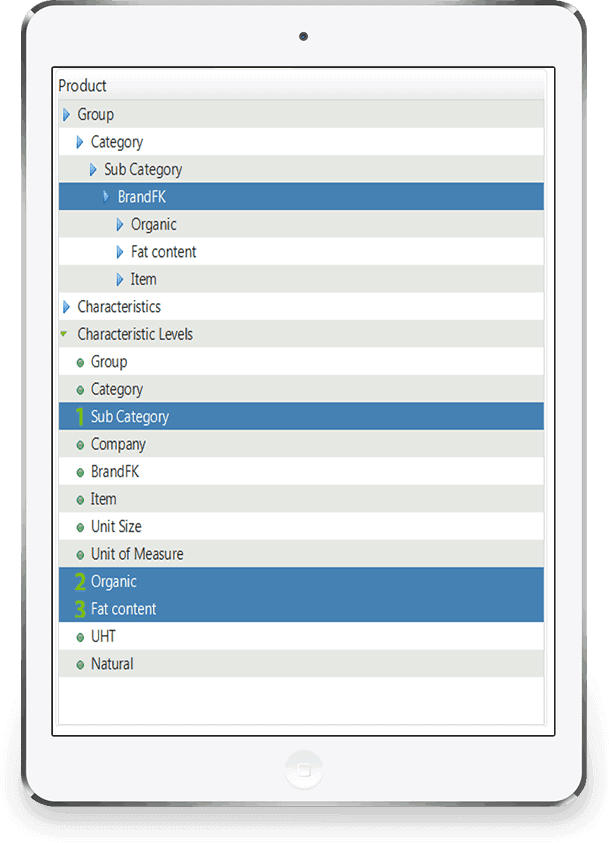
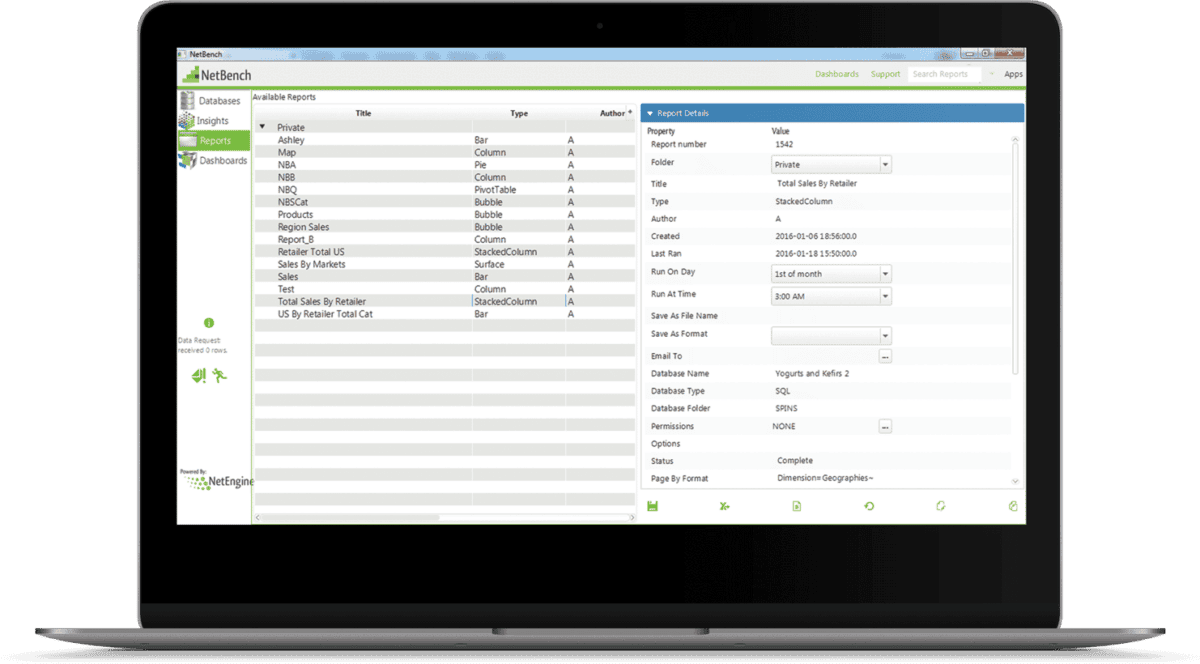
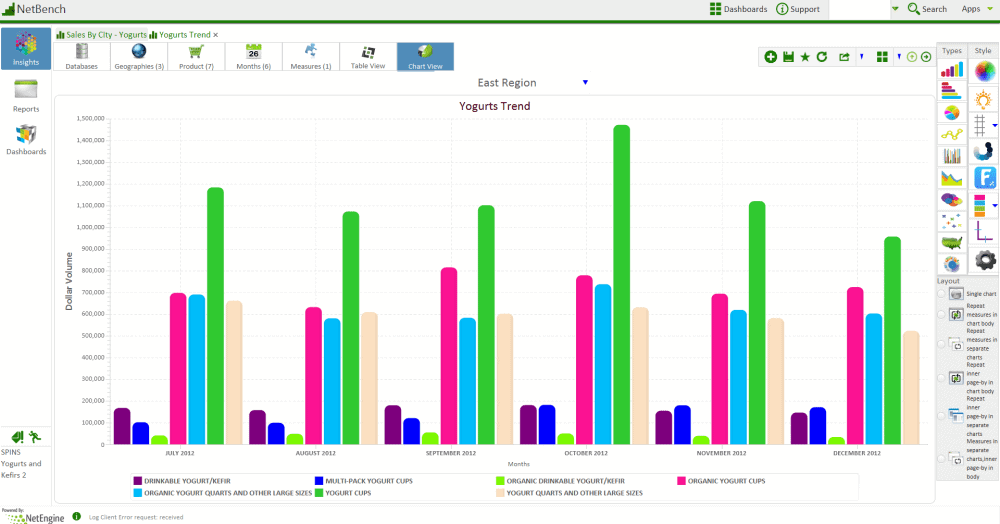
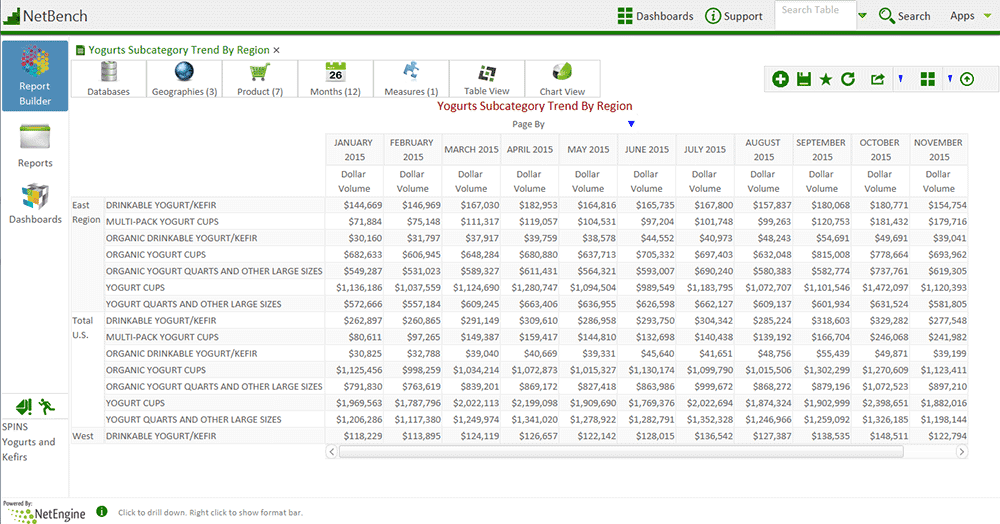
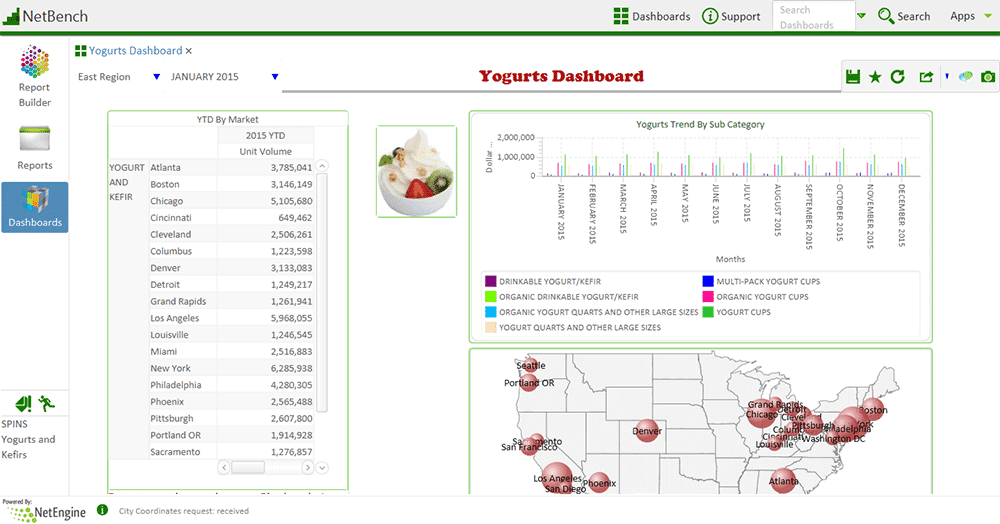
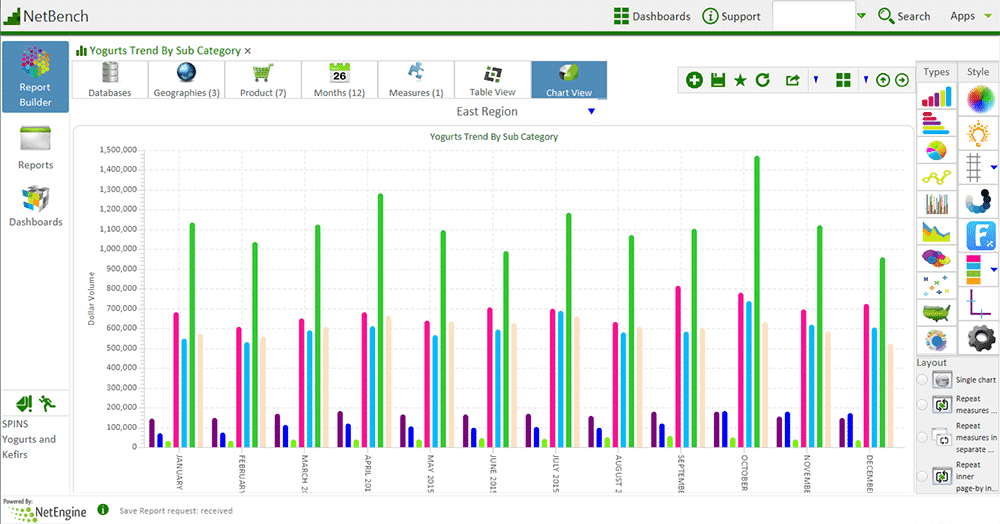
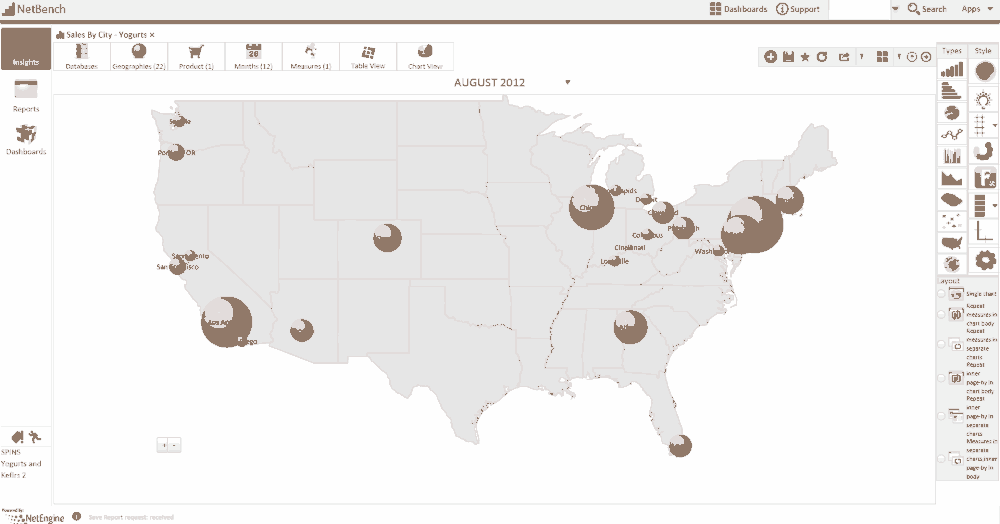
Dashboards Flexibility Reporting Screenshots Get more out of your data Bring disparate data together, maximizing insights. FeaturesCustom charts & graphsDrag & drop features for pivoting and formattingRun multiple reports simultaneouslyAdd charts and tables to dashboard with a single clickRefresh data from data sources quicklyExport dashboard to PDFExport dashboard to ExcelRanking, exception reporting, and drill down capabilitiesIntellitext for data-driven headlines FlexibilitySee data your way. Flexibility See data your way. FeaturesOn-the-fly segmentation for geographies and productsMulti-layered hierarchiesCross-dimensional aggregation rulesHandle billions of rows of data seamlessly without compromising speedStream in and out of data sourcesCustom geography, product and time dimensions all in real-time.Integrate retailer POSAnalytics rolled up from store or UPC levelGeographical, store and row level embedded securityNetBench technology reads from the source, no need for data cubesCapabilities to build a retailer and/or manufacturer view for a category with retailer product segmentation and retailer regions Reporting Enhanced features for a new way of reporting. FeaturesOrganize into folders and favoritesAdd/remove headers easily with drop-down featureView report elementsSchedule individual reports or batchesAuthor has publishing rights to reportsChange the visual element of a report with one clickEmail without launching the reportEasily refresh data within the report, quickly updating from all data sources Screenshots See for yourself what NetBench has to offer.